Why is Killer Whale Putting in a Laddered Order for 250 Shares of GBTC??

Grayscale Bitcoin Trust (GBTC)
There are some factors at play that could cause Bitcoin to drop as low or lower than $35k. So why is Killer Whale buying 250 shares of Grayscale Bitcoin Trust GBTC?
Friends there have been some news and technical driven catalysts that have been tough for the crypto industry in the past week. We have seen the word of an eccentric billionaire make retail traders run for the hills. The 21 Week Exponential Moving Average is being tested again today. The IRS in the United States is pushing back on Binance and it seems just about every news outlet is calling this the top. The top of what? Is that it? BTC going back to $0?
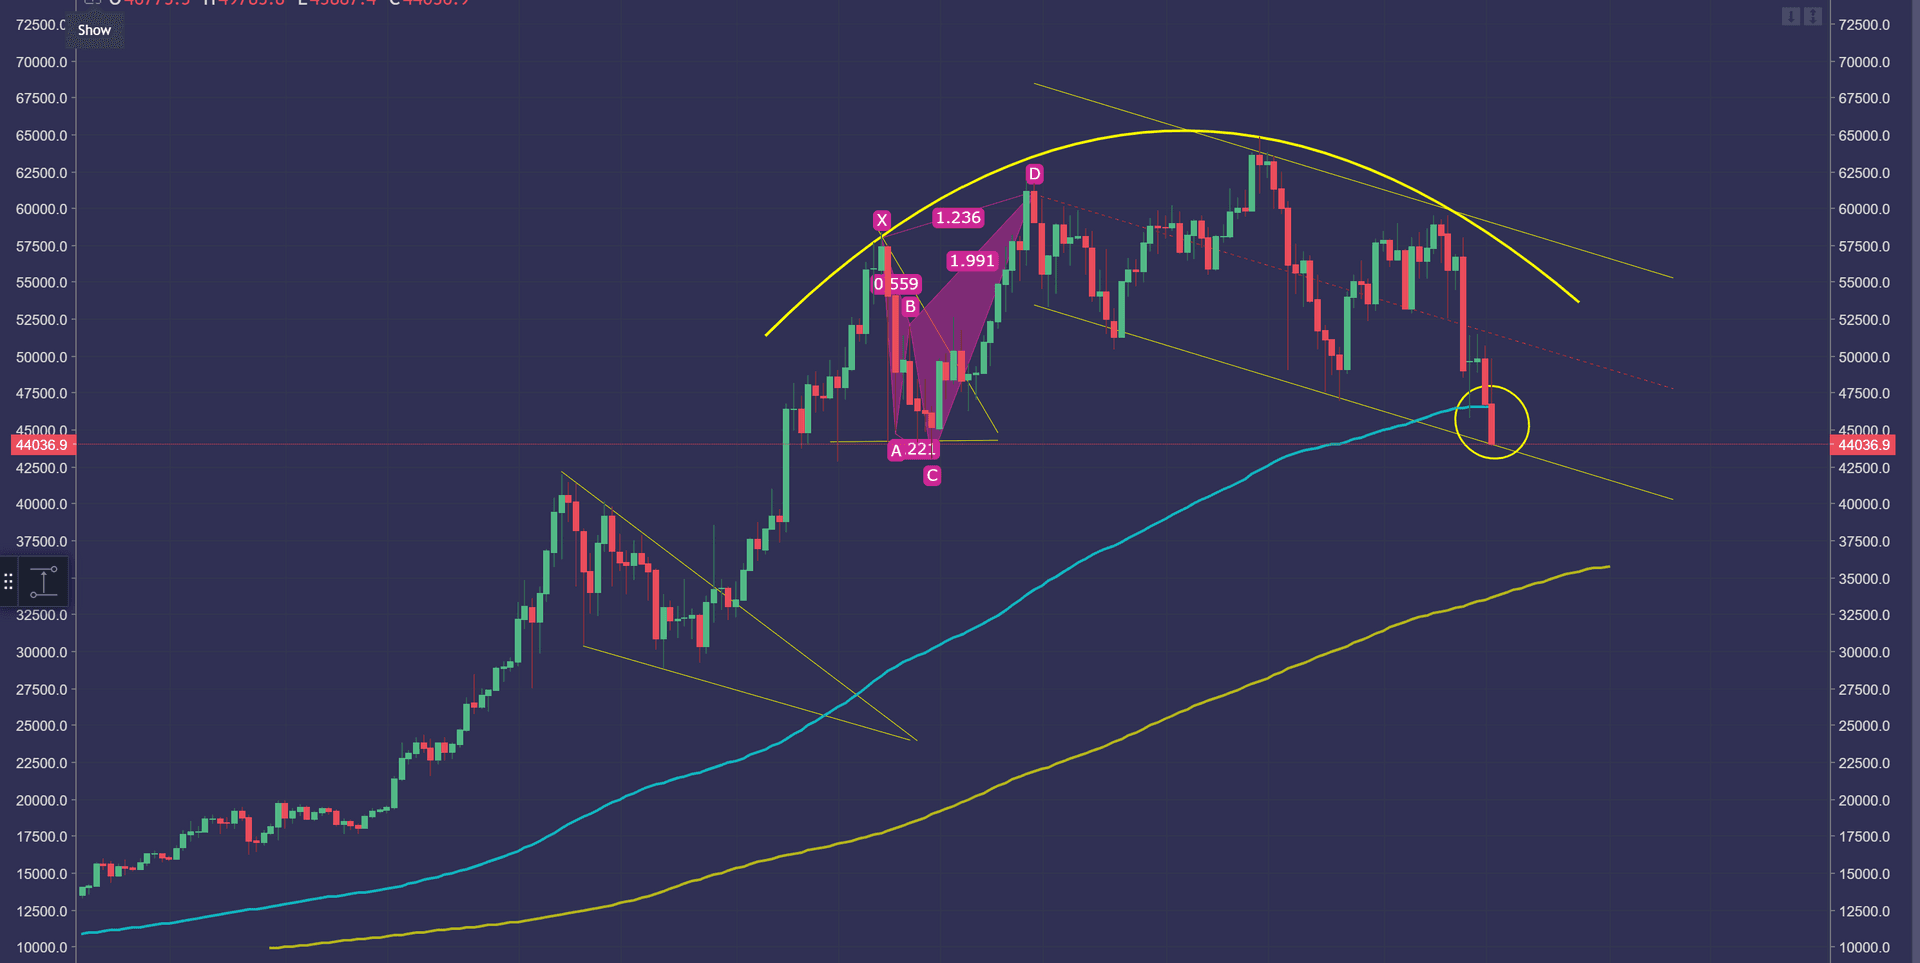
Lets take a look at BTC/USDT on the Daily Timescale. The bright blue line on the chart is the equivalent of the 21 Week Exponential Moving Average (EMA). In my book the most prominent moving average in all of cryptocurrency is the 21 Week EMA and how Bitcoin specifically moves with it. You will notice in this photo that currently and most likely at todays candle close will be below the 21 Week EMA. This past week is also the first time in over a year that Bitcoin's price actions has even come to interact with the 21 Week EMA. You will also notice that Bitcoin is forming a very well defined rounding top. Rounding top patterns are inherently bearish. The punches just keep coming as we also observe the most recent months worth of price action is forming a descending channel. Descending channel patterns can often become mid term consolidations remaining rangebound within the structure for weeks or months on end if not failing entirely. I am not trying to scare you with this, just making us all aware of the Technical factors at play.
The price action is swiftly moving toward the Killer Whale 3rd Point of Demand (the gold line below the price action in this chart). The level where the price action meets the Third Point of Demand at approximately $33k. This is the ultimate level of bullish control. This means that as long as we are above $33k the Macro trend is still intact.

The image below is BTC/USD on the one day timescale on Coinbase. In this chart you cant help but notice just how parabolic this trend has been since September 2020. This is indicative of the exuberance that pushed Bitcoin's Market Cap to over 1 Trillion.

The image below is BTC/USDT zoomed into the close of yesterdays candle, notice how hard Bitcoin is fighting to keep control of the 21 Week EMA with long wicks on both sides of the candle. Long wicks on either side of a candle means that trader psychology has come to a stale mate with bearish undertones because the candle closed red.

So back to the question why am I laddering into GBTC vs. holding Bitcoin itself? To put it simply I am fully prepared to hold these positions for multiple years and I wish to not hold the liability of custody. I am willing to let Grayscale custody the assets for me. This particular position trade I fully intend to sell in the future so I will never run the risk of losing a wallet or key. Also it never hurts to keep your eggs in different baskets, so in terms of traditional investments this is a great diversification into a higher risk/ higher reward long term play for my macro trading style. You can see off to the right of the image below I have laddered orders down to $32 for GBTC.

Friends we will learn time and time again that BTC is one of the most scarce assets on earth, with every dump there is a pump and with every pump there is a dump. That's just how this crypto volatility game works. Lets look at the Fear and Greed Index, you will notice how quickly the sentiment can go from Extreme Greed to Extreme Fear. We thrive on the contrarian ideals of buying in fear and selling in greed. As Warren Buffet says you buy when there is blood in the street. I am confident to say that after a drop of nearly 30% from Bitcoin's top of $64k, this is an area of interest for the contrarian investor.

Stay Strong Friends!!
Killer Whale Crypto
Most Recent

6 Reasons Why HODL Is So Last Bull Run
Ashley E. Shiver - May 18, 2024

Bitcoin Halving Explained
Ashley E. Shiver - Apr 24, 2024

7 Ways Business Owners Can Utilize Cryptocurrency to Enhance Operations
Ashley E. Shiver - Apr 24, 2024

Embracing the Future: Algorithm Intelligence
Ashley E. Shiver - Apr 24, 2024

Enterprise Solutions
Ashley E. Shiver - Apr 9, 2024

Killer Whale Portfolio Management Service
Ashley E. Shiver - Apr 9, 2024
Stay Up To Date
Get weekly insights and updates from the Killer Whale Crew
Categories
Start Trading
Large Cap
strategy
Trade Duration
Trade Frequency
Gain ETH
strategy
Trade Duration
Trade Frequency
Gain BTC
strategy
Trade Duration
Trade Frequency
Pro
strategy
Trade Duration
Trade Frequency