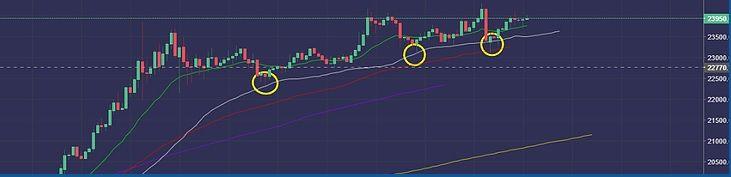
Trader Psychology Printed on 1 Hour BTC/USDT Chart

What is dollar cost averaging in crypto trading? It can help your trading strategy, by holding your investment and getting greater returns.
The White Line in my charts represents the Second Point of Demand (2PD) or the Second most likely place for buy orders to be at any point in a certain timescale. The image above is on the 1 hour chart, the lower timeframe you go to will determine the Overall Strength of the particular Point of Demand. What you will notice in this photo is that even looking at insignificant timescales such as the 1 Hour, the mass psychology has caused a chain reaction in which Bitcoin is consistently gone no lower than the 2PD.
How long can this price action last you must be asking?
How long can BTC continue to rise on a meteoric Moon Shot?
The answer may surprise you...

The calculation to determine Market Cap is and an asymmetric metric of measurement in its nature. The Bitcoin market cap refers to the total value of all the Bitcoin that has been issued. It can be calculated by multiplying the total number of Bitcoins in circulation by the Bitcoin price. The Market Cap of Bitcoin is so small compared to the world stage of assets, yet Bitcoin is so incredibly scarce.... Only 21 million will exist.
What can we derive from this?
You will see in the photo to the right is the Market Cap of Bitcoin appreciating by 150% since July 2020. That is flabbergasting to say the least and if you think this gravy train is stopping in our lifetime.... it might be time to reconsider that thought. The techniques used in price discovery of an asset are incredibly simple at times if you just look where an asset has been and the metrics of the market psychology. Who is Buying or Selling, How Much and Why?
The fact of the matter is we have never been in this Technical Landscape and searching for the next Big Dip may come less often then in the past. The market will inevitably become more stable as time progresses and the large life-changing swings will become fewer and further between.
What is the solution?
Dollar Cost Average Hodling and Sticking to a Plan!! Weather that plan is buy once a week, use Signals, AI technology, Bots.... Learn it and learn it well because this opportunity will pass in time as all things do. Do get all jumpy FOMO on me though friends this is just the tip of the iceberg!!
Most Recent

6 Reasons Why HODL Is So Last Bull Run
Ashley E. Shiver - May 18, 2024

Bitcoin Halving Explained
Ashley E. Shiver - Apr 24, 2024

7 Ways Business Owners Can Utilize Cryptocurrency to Enhance Operations
Ashley E. Shiver - Apr 24, 2024

Embracing the Future: Algorithm Intelligence
Ashley E. Shiver - Apr 24, 2024

Enterprise Solutions
Ashley E. Shiver - Apr 9, 2024

Killer Whale Portfolio Management Service
Ashley E. Shiver - Apr 9, 2024
Stay Up To Date
Get weekly insights and updates from the Killer Whale Crew
Categories
Start Trading
Large Cap
strategy
Trade Duration
Trade Frequency
Gain ETH
strategy
Trade Duration
Trade Frequency
Gain BTC
strategy
Trade Duration
Trade Frequency
Pro
strategy
Trade Duration
Trade Frequency