TOTAL Chart for Crypto

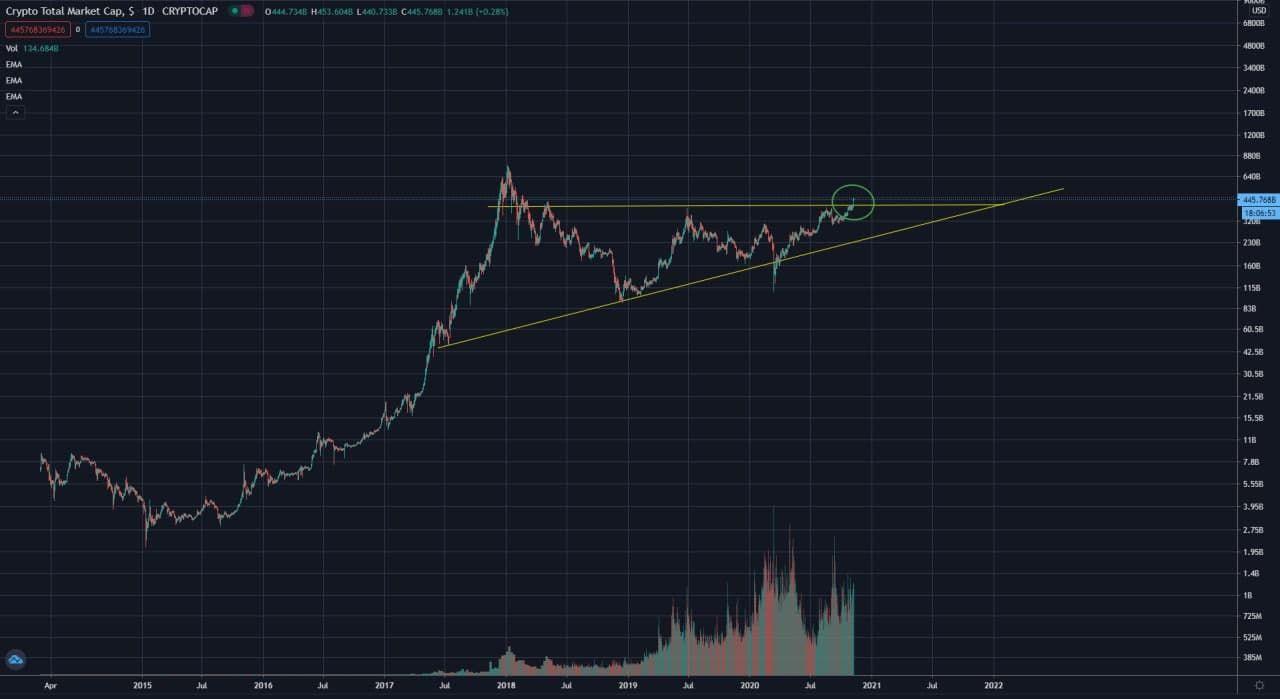
Combined crypto chart that represents Billions of Dollars of Market Cap

This Chart represents every single Crypto... Combined represented in Billions of Dollars of Market Cap and what do you know we are breaking and Ascending Triangle. An Ascending Triangle is created by price moves that allow for a horizontal line to be drawn along the swing highs, and a rising trendline to be drawn along the swing lows. The two lines form a triangle. Traders often watch for breakouts from triangle patterns. The breakout can occur to the upside or downside. Ascending triangles are often called continuation patterns since the price will typically breakout in the same direction as the trend that was in place just prior to the triangle forming.
An ascending triangle is tradable in that it provides a clear entry point, profit target, and stop loss level. Hmmm.... Wow, ALL of Crypto is breaking out on the Daily Chart. Stay Vigilant Out There
Most Recent

6 Reasons Why HODL Is So Last Bull Run
Ashley E. Shiver - May 18, 2024

Bitcoin Halving Explained
Ashley E. Shiver - Apr 24, 2024

7 Ways Business Owners Can Utilize Cryptocurrency to Enhance Operations
Ashley E. Shiver - Apr 24, 2024

Embracing the Future: Algorithm Intelligence
Ashley E. Shiver - Apr 24, 2024

Enterprise Solutions
Ashley E. Shiver - Apr 9, 2024

Killer Whale Portfolio Management Service
Ashley E. Shiver - Apr 9, 2024
Stay Up To Date
Get weekly insights and updates from the Killer Whale Crew
Categories
Start Trading
Large Cap
strategy
Trade Duration
Trade Frequency
Gain ETH
strategy
Trade Duration
Trade Frequency
Gain BTC
strategy
Trade Duration
Trade Frequency
Pro
strategy
Trade Duration
Trade Frequency