LTC Cup and Handle Formation in Progress

Is that a Daily Sized Cup and Handle Formation on LTC??
Friends lets first begin by saying without more confirmation of consolidative price action at or above $130-$160 this is only a theory.... a hypothesis of future outcomes based on past action. However the timescale of this chart we have plenty of time to watch this play out!!
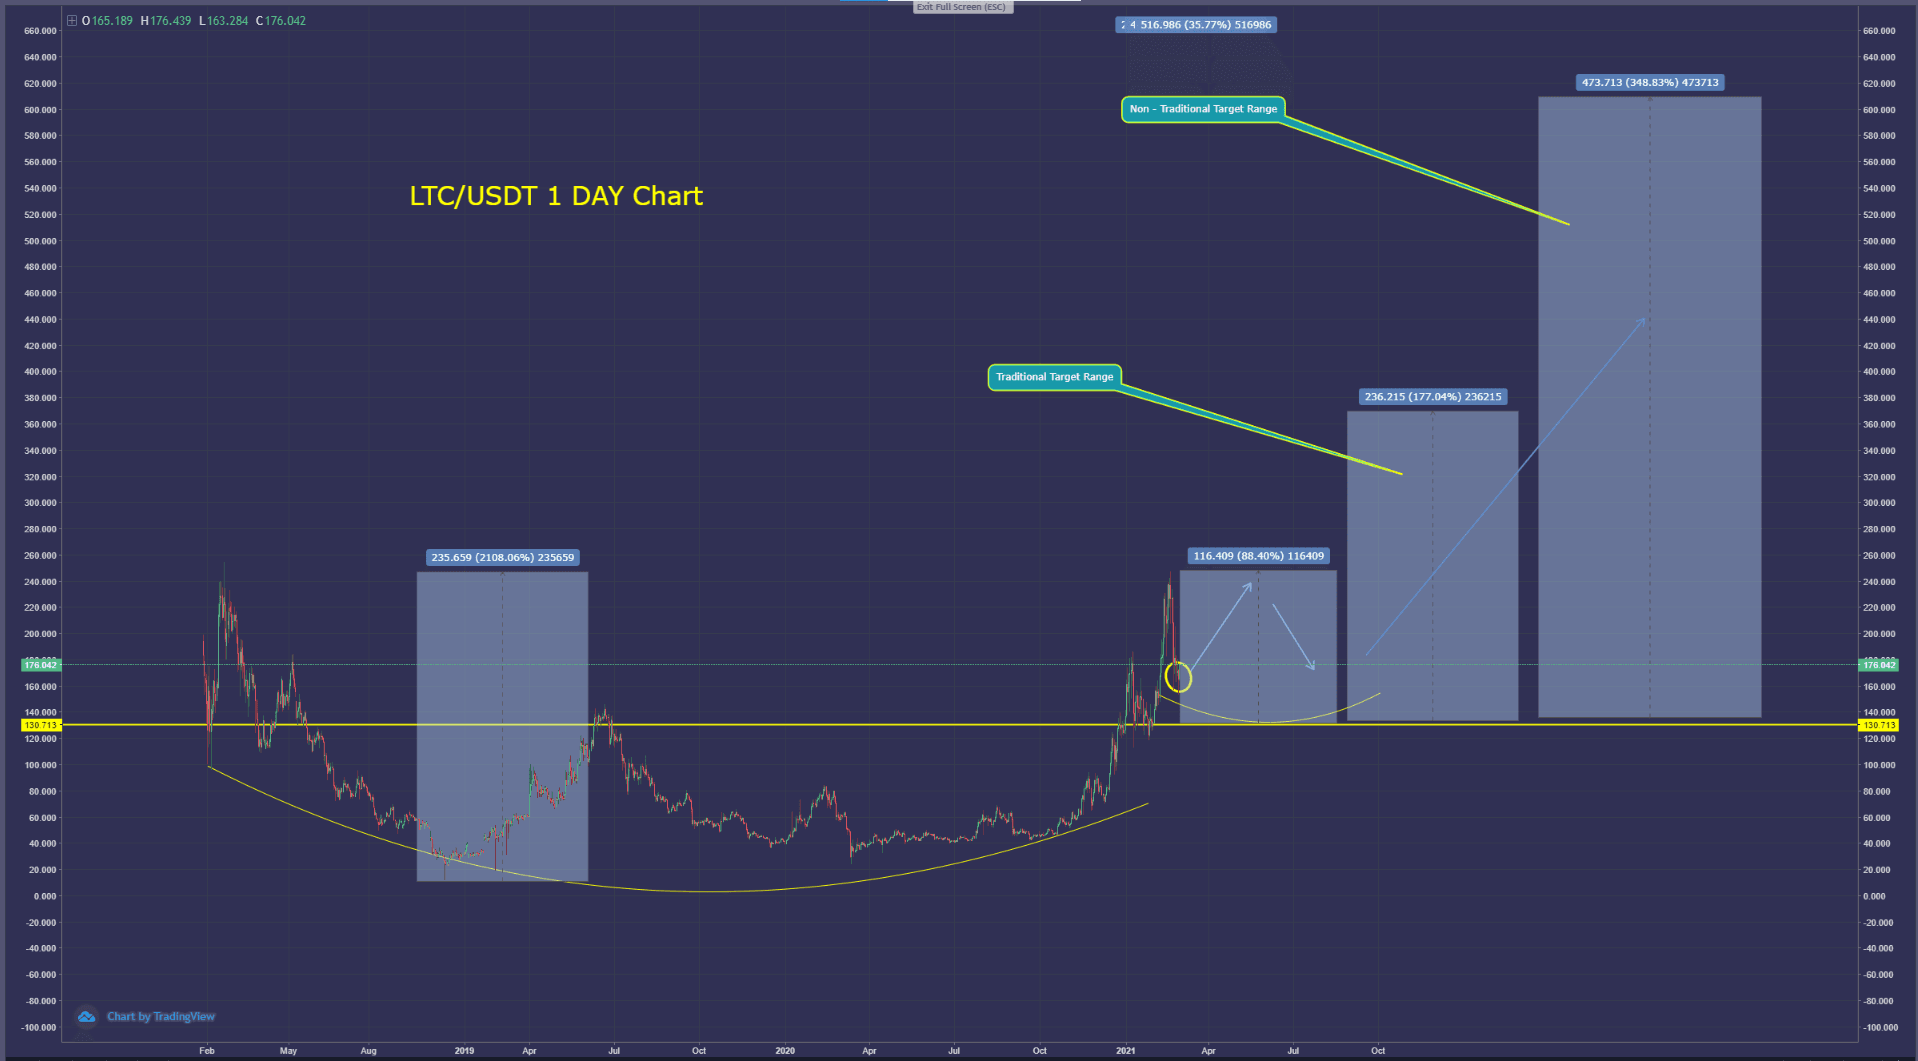
In this Article I would like to talk about the Timescale of Trading on the Macro level. This LTC/USDT "Cup and Handle Formation" began forming at the highest peak on 02.20.2018. The pattern had absolutely no defined shape until 02.28.2021. That is a solid 3 years to potentially "begin" to form one Macro bullish formation... that is a long time, but oh so juicy. What we Killer Whales live for is to recognize huge trend shifting structures down to the day they are painted on the chart.
WOW
Now notice how simple this chart is at its core. The only Technical Analysis Points on the entire chart above are the 2 curved gold lines and the 1 horizontal gold line. The rest is just measuring the structure. Next is the identification of speculative entry points. Well if this structure is going to be validated, anywhere between $130-$190 is the highest area of value. Which is crazy to think about because just on Halloween 2020 LTC was under $60. I am not saying go out and bet the farm on LTC here what I am saying is to keep it on your radar for the next 2-3 months. When and IF this thing decides to blow... we gonna be calling uncle Elon to hitch a ride to Mars. In this image the first two target ranges off to the right are the Traditional Target Ranges. The third Target Range is just for the sake of speculation. Cryptocurrencies are bit special in a way because of the asymmetric percentage gains due to the size of their market caps respectively.
The Image below is LTC/USDT on the 4hr chart:

This image is zoomed in on the right side of the "Cup" and the very beginnings of a potential "Handle". What you will notice is the Gold Line crossing through the bubbles represents the Killer Whale Third Point of Demand or the most likely place on a given Timescale that buy orders will be. In this case the 4hr Timescale.
Lets now Zoom into the 15 Minute Chart:

Timescale hopping for me starts on the Weekly or Monthly for a discernable trend pattern or outcome. In this case we are zoomed all the way into the exact series of Price Action that could become the Handle we are spit-balling on.
What do you know? Is the 15 minute Micro Consolidation beginning to "Confirm" our theory by bouncing off the respective 15 minute Third Point of Demand?
We shall see. All we need to do now is pump to or above previous All Time High from 2018 at $237 briefly to further "Confirm" this idea. Think about it. Do your own research on this before making trading decisions. I am merely guiding you on how Killer Whale comes to conclusions. Believe me, I will continue to provide this kind of critical TA.
Most Recent

6 Reasons Why HODL Is So Last Bull Run
Ashley E. Shiver - May 18, 2024

Bitcoin Halving Explained
Ashley E. Shiver - Apr 24, 2024

7 Ways Business Owners Can Utilize Cryptocurrency to Enhance Operations
Ashley E. Shiver - Apr 24, 2024

Embracing the Future: Algorithm Intelligence
Ashley E. Shiver - Apr 24, 2024

Enterprise Solutions
Ashley E. Shiver - Apr 9, 2024

Killer Whale Portfolio Management Service
Ashley E. Shiver - Apr 9, 2024
Stay Up To Date
Get weekly insights and updates from the Killer Whale Crew
Categories
Start Trading
Large Cap
strategy
Trade Duration
Trade Frequency
Gain ETH
strategy
Trade Duration
Trade Frequency
Gain BTC
strategy
Trade Duration
Trade Frequency
Pro
strategy
Trade Duration
Trade Frequency