Simple Moving Average vs. Exponential Moving Average

Educational Segment on Simple and Exponential Moving Averages!
Simple Moving Average:
A simple moving average (SMA) calculates the average of a selected range of prices, usually closing prices, by the number of periods in that range.
KEY TAKEAWAYS:
- A simple moving average (SMA) calculates the average of a selected range of prices, usually closing prices, by the number of periods in that range.
- A simple moving average is a technical indicator that can aid in determining if an asset price will continue or if it will reverse a bull or bear trend.
- A simple moving average can be enhanced as an exponential moving average (EMA) that is more heavily weighted on recent price action. Understanding a Simple Moving Average (SMA)
- A simple moving average (SMA) is an arithmetic moving average calculated by adding recent prices and then dividing that figure by the number of time periods in the calculation average. For example, one could add the closing price of a security for a number of time periods and then divide this total by that same number of periods. Short-term averages respond quickly to changes in the price of the underlying security, while long-term averages are slower to react.
The SMA is the most common type of average used by technical analysts and is calculated by dividing the sum of a set of prices by the total number of prices found in the series. For example, a seven-period moving average can be calculated by adding the following seven prices together and dividing the result by seven (the result is also known as an arithmetic mean average).
Example Given the following series of prices: $10, $11, $12, $16, $17, $19, $20 The SMA calculation would look like this: $10+$11+$12+$16+$17+$19+$20 = $105 7-period SMA = $105/7 = 15
Exponential Moving Average:
An exponential moving average (EMA) is a type of moving average (MA) that places a greater weight and significance on the most recent data points. The exponential moving average is also referred to as the exponentially weighted moving average. An exponentially weighted moving average reacts more significantly to recent price changes than a simple moving average (SMA), which applies an equal weight to all observations in the period.
KEY TAKEAWAYS:
- The EMA is a moving average that places a greater weight and significance on the most recent data points.
- Like all moving averages, this technical indicator is used to produce buy and sell signals based on crossovers and divergences from the historical average.
- Traders often use several different EMA lengths, such as 10-day, 50-day, and 200-day moving averages.
Getting Technical:
While there are many possible choices for the smoothing factor, the most common choice is, Smoothing = 2. That gives the most recent observation more weight. If the smoothing factor is increased, more recent observations have more influence on the EMA. Calculating the EMA requires one more observation than the SMA. Suppose that you want to use 20 days as the number of observations for the EMA. Then, you must wait until the 20th day to obtain the SMA. On the 21st day, you can then use the SMA from the previous day as the first EMA for yesterday.
The calculation for the SMA is straightforward. It is simply the sum of the assets closing prices during a time period, divided by the number of observations for that period. For example, a 20-day SMA is just the sum of the closing prices for the past 20 trading days, divided by 20.
Next, you must calculate the multiplier for smoothing (weighting) the EMA, which typically follows the formula: [2 ÷ (number of observations + 1)]. For a 20-day moving average, the multiplier would be [2/(20+1)]= 0.0952.
Finally, the following formula is used to calculate the current EMA:
EMA = Closing price x multiplier + EMA (previous day) x (1-multiplier) The EMA gives a higher weight to recent prices, while the SMA assigns equal weight to all values. The weighting given to the most recent price is greater for a shorter-period EMA than for a longer-period EMA. For example, an 18.18% multiplier is applied to the most recent price data for a 10-period EMA, while the weight is only 9.52% for a 20-period EMA.
There are also slight variations of the EMA arrived at by using the open, high, low, or median price instead of using the closing price.
Killer Whale Insights:
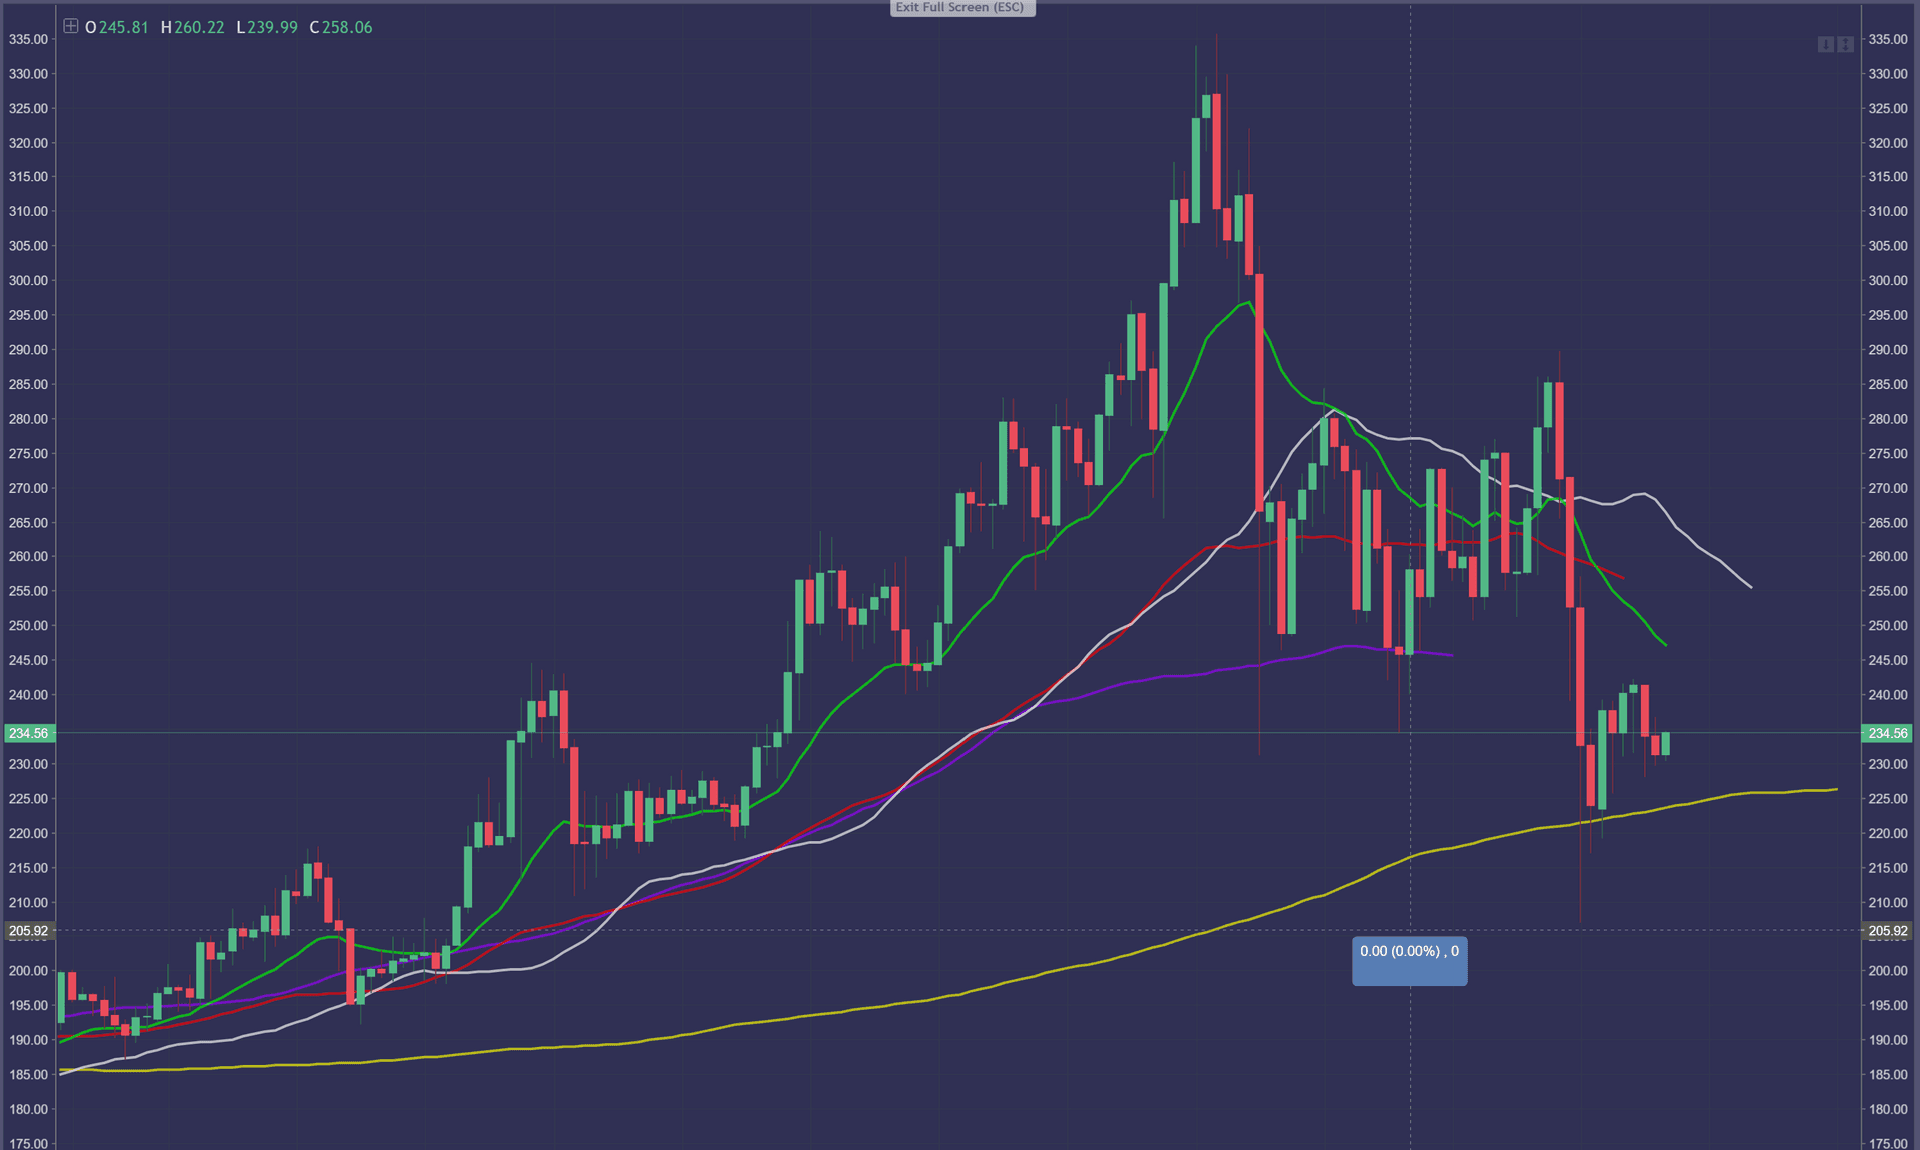
I use SMA's and EMA's that are weighted and displaced to calculate the Killer Whale Points of Demand. Learn about the 21 Week Exponential Moving Average and how BTC (specifically) reacts to it. This one concept, will automatically put you on another level in the crypto world!
What I would like to explain today could possibly blow your mind. When thinking about the movement of a Trend and the Averages associated with the Target Entry Point on an Asset, there is a constant that never fails... What is this constant you might ask?
21 weeks, 147 days and 3528 hours on the Exponential Moving Average. These specific metrics and their divisions/multiplications coincide time and time again with Fibonacci Retracement Levels. In the Image below you will notice how these moving averages correlate to the Fibonacci Retracement levels on EOS/USDT over the past month or so.
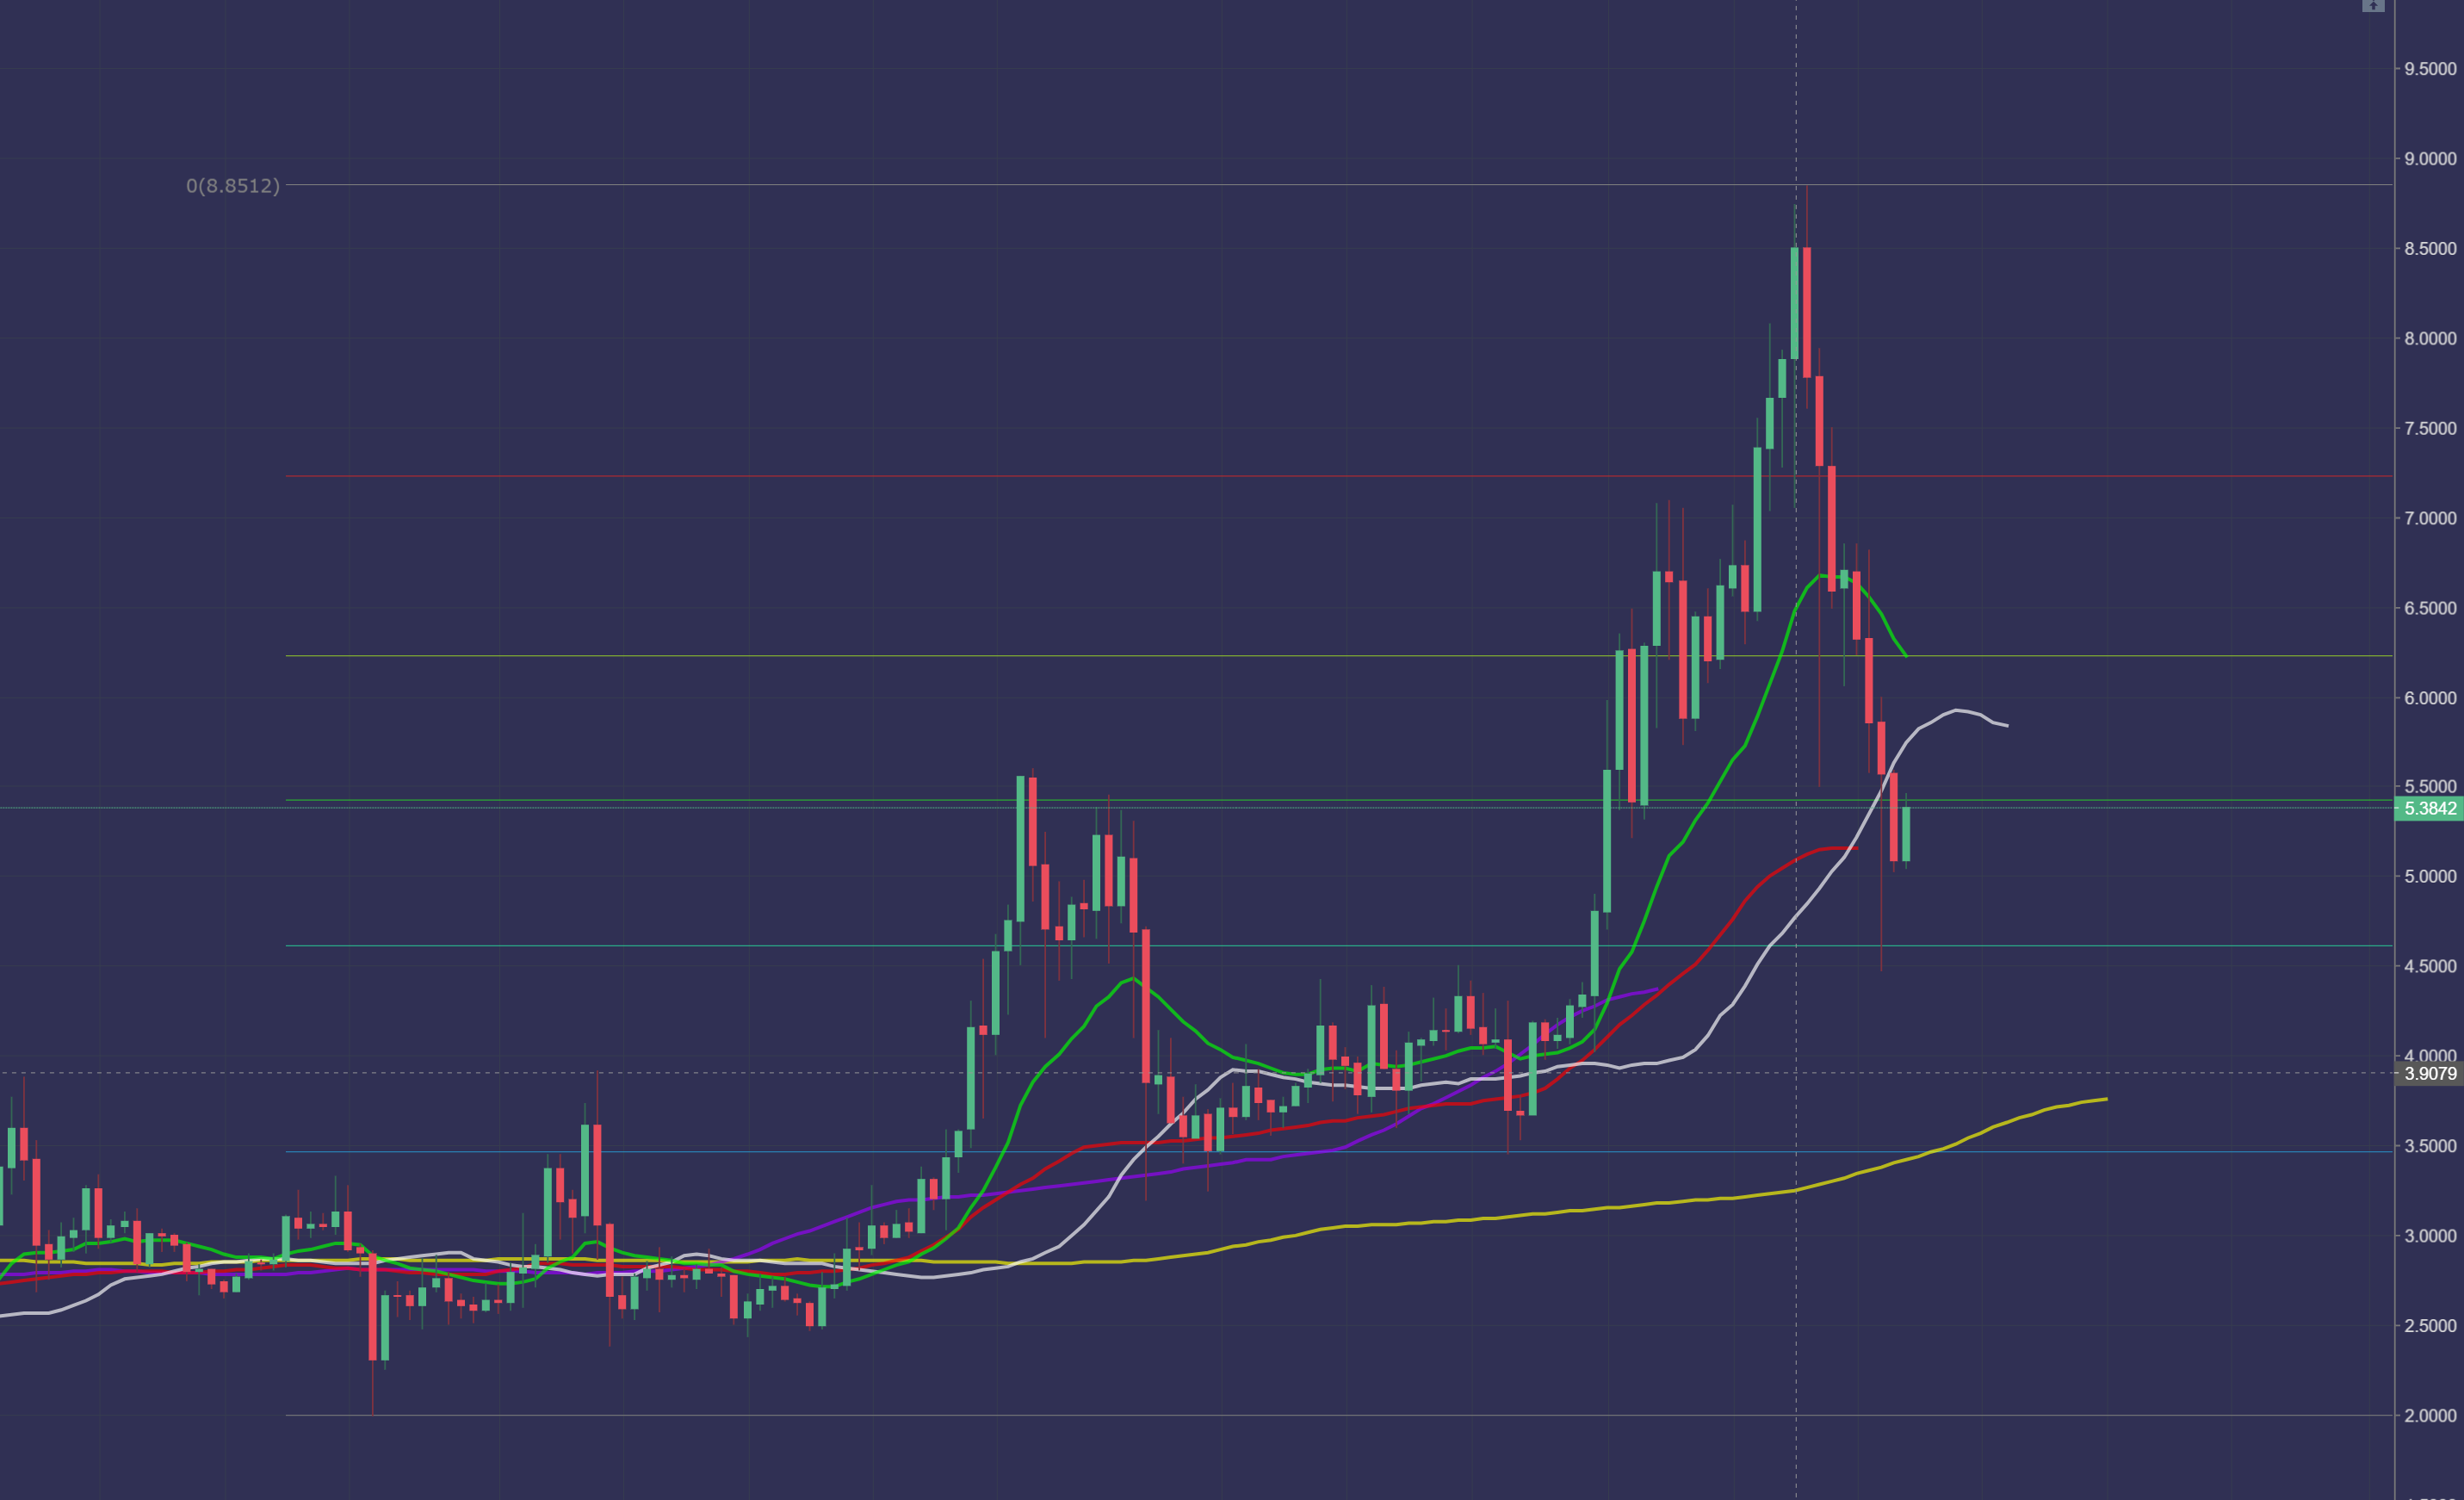
Points of Demand:
First Point of Demand (1PD) - The first and weakest level that Buy Orders are most likely to be (green curved line just above the price action)
Second Point of Demand (2PD) - The second most likely level that Buy Orders are most likely to be (white curved line just above the price action)
Third Point of Demand (3PD) - The absolute level that Buy Orders are accumulated in a certain Time Scale (gold curved line just below the price action).
Depending on the Time Scale of the Chart that is being analyzed will determine the Ultimate Price Control Zone of either the Bulls or the Bears. In the case of Demand the price action of an Up-Trend means the Bulls have Ultimate Control of the Trend.
Wow! Its a lot to take in I know, just stay with me.
Each Point of Demand is Directly Correlated with the Time Scale equivalent of the 21 Week Exponential Moving Average and directly correlates with Fibonacci Retracements.
Try it on your own I encourage you to have an Epiphany!
Killer Whale Crypto
Most Recent

6 Reasons Why HODL Is So Last Bull Run
Ashley E. Shiver - May 18, 2024

Bitcoin Halving Explained
Ashley E. Shiver - Apr 24, 2024

7 Ways Business Owners Can Utilize Cryptocurrency to Enhance Operations
Ashley E. Shiver - Apr 24, 2024

Embracing the Future: Algorithm Intelligence
Ashley E. Shiver - Apr 24, 2024

Enterprise Solutions
Ashley E. Shiver - Apr 9, 2024

Killer Whale Portfolio Management Service
Ashley E. Shiver - Apr 9, 2024
Stay Up To Date
Get weekly insights and updates from the Killer Whale Crew
Categories
Start Trading
Large Cap
strategy
Trade Duration
Trade Frequency
Gain ETH
strategy
Trade Duration
Trade Frequency
Gain BTC
strategy
Trade Duration
Trade Frequency
Pro
strategy
Trade Duration
Trade Frequency